
1. Introduction: The Backbone of Indonesia’s Maritime Economy
Indonesia, the world’s largest archipelagic nation, sits at a critical juncture in its logistical evolution. With over 17,000 islands and a maritime territory that produces over 7 million metric tons of fish annually, the necessity for a robust cold chain is not merely an industrial requirement—it is a matter of national food security and economic sovereignty.
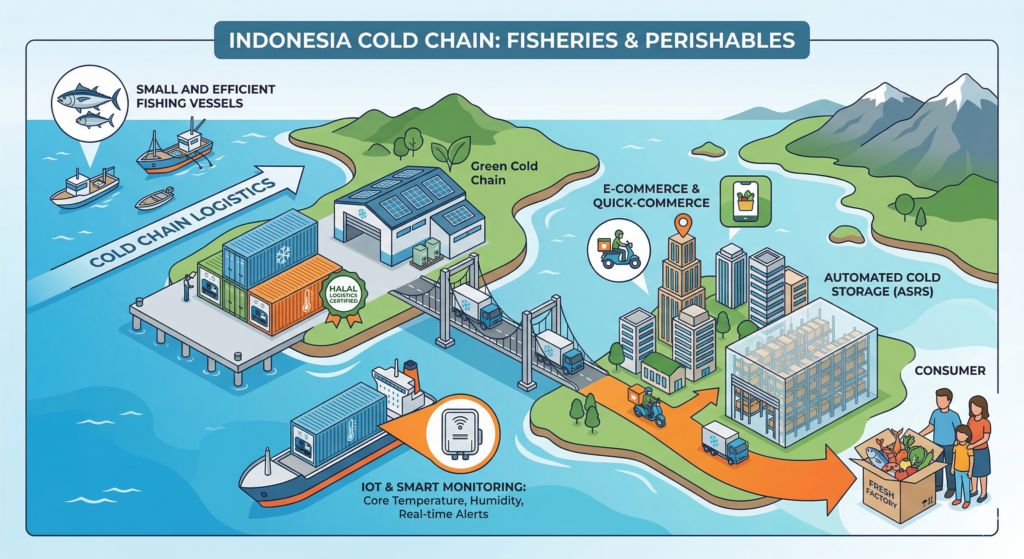
The “Cold Chain” refers to the temperature-controlled supply chain that includes refrigerated production, storage, and distribution activities. In Indonesia, this sector is currently undergoing a massive transformation driven by shifting consumer behaviors, a booming e-commerce landscape, and stringent international export standards. As of 2026, the integration of IoT (Internet of Things) and blockchain is no longer a luxury but a standard for high-value exports like tuna, shrimp, and premium perishables.
2. Current Market Dynamics
Market Trends: The Rise of “Quick-Commerce”
The Indonesian consumer landscape has shifted toward convenience. The post-pandemic era solidified the “e-grocery” trend, where urban populations in Jakarta, Surabaya, and Medan expect fresh seafood and produce delivered within hours. This has forced logistics providers to move away from bulk storage toward last-mile refrigerated delivery and micro-fulfillment centers.
Regulatory Pulse: Blue Economy & Halal Compliance
The Indonesian government, through the Ministry of Marine Affairs and Fisheries (KKP), has implemented the “Blue Economy Roadmap.” This includes:
-
Standardization (PP No. 17/2023): New operational standards for cold storage that mandate energy efficiency and real-time temperature logging.
-
Halal Logistics: Under Government Regulation 42/2024, cold chain providers must now ensure “Halal Integrity” for the storage of meat and certain seafood products, creating a niche for certified cold storage operators.
Infrastructure Bottlenecks
Despite growth, the “Archipelago Paradox” remains. While Java holds over 60% of the cold storage capacity, the highest fish production occurs in Eastern Indonesia (Maluku, Papua). This geographical mismatch results in high logistics costs, which can account for up to 25-30% of the final product price.
3. Market Landscape: Strategic Segmentation
The Indonesian cold chain is bifurcated into two primary segments: Cold Storage (Warehousing) and Cold Transport (Logistics).
Segmentation by Temperature Range
-
Frozen (-18°C to -25°C): Dominates the market (approx. 60% share) due to the high volume of frozen fish, shrimp, and meat exports.
-
Chilled (0°C to 15°C): Rapidly growing due to the dairy, fruit, and vegetable sectors.
-
Deep-frozen (Below -25°C): Specifically for premium Sashimi-grade tuna and pharmaceutical biologics.
Key Regional Hubs
-
Greater Jakarta (Jabodetabek): The consumption capital.
-
Surabaya: The gateway to Eastern Indonesia.
-
Bitung & Makassar: Key collection points for the fisheries industry.
4. Market Size & Growth Forecasts (2024–2031)
The market is entering a phase of accelerated expansion. In 2024, the market was valued at approximately USD 5.1 Billion. By 2026, it is projected to reach USD 7.5 Billion, heading toward a staggering USD 10.2 Billion by 2030.
Key Growth Indicators (CAGR)
The sector is expected to maintain a CAGR of 10.6% over the next five years.
| Year | Estimated Market Size (USD Billion) | Growth Rate (%) |
| 2024 | 5.08 | Baseline |
| 2025 | 7.19 | +12.1% |
| 2026 | 7.51 | +4.4% (Stabilizing) |
| 2030 | 10.22 | Projected |
| 2031 | 11.68 | Forecast |
5. Competitive Landscape
The market is fragmented but maturing. It consists of a mix of state-owned enterprises (BUMN), local giants, and international logistics firms.
Top Market Players
-
Coldspace: A tech-driven leader focusing on end-to-end integrated solutions.
-
Fresh Factory: Specialist in hyper-local cold chain fulfillment.
-
Enseval Putera Megatrading: Strong in the pharmaceutical cold chain.
-
Kiat Ananda Group: One of the largest refrigerated transport fleets in Indonesia.
-
MG Logistik: Significant player in the fisheries export-import sector.
Market Share Estimate (By Category)
-
Fisheries & Seafood: 42.2%
-
Meat & Poultry: 22.5%
-
Fruits & Vegetables: 15.3%
-
Pharmaceuticals: 10.0%
-
Others (Dairy/Processed): 10.0%
6. Market Insights: Tech Integration & Sustainability
The IoT Revolution
In 2026, “Passive Cooling” is being replaced by “Smart Monitoring.” Sensors attached to reefer containers now transmit live data on:
-
Core Temperature: Preventing “cold breaks” that ruin fish quality.
-
Humidity Levels: Crucial for agricultural perishables.
-
Door Openings: Monitoring unauthorized access and energy loss.
The Sustainability Shift (Green Cold Chain)
With electricity costs being a major overhead, operators are pivoting to:
-
Solar-Powered Cold Storage: Particularly in remote islands like Natuna and Morotai.
-
Natural Refrigerants: Moving away from HFCs to CO2 and Ammonia-based systems to meet international environmental standards.
7. Market Opportunities & Future Outlook
The “Cold Hub” Opportunity in Eastern Indonesia
There is a massive investment gap for cold storage in the Maluku and Papua regions. Currently, fish is often transported “warm” to intermediate hubs, leading to a 30% loss in value. Investors focusing on small-scale, modular, solar-powered blast freezers in these regions will capture the “source-side” of the market.
Automated Cold Storage (ASRS)
As land prices in Jakarta and Surabaya skyrocket, Automated Storage and Retrieval Systems (ASRS) are becoming viable. These high-density vertical warehouses reduce human labor in sub-zero temperatures and maximize space efficiency.
Conclusion
The Indonesian cold chain is no longer just about “keeping things cold.” It is an integrated technology play that bridges the gap between the remote fisherman in Sulawesi and the premium sushi restaurant in Tokyo or the suburban family in Tangerang. For investors and operators, the next five years will be defined by geographical expansion and technological adoption.
$7.51 Billion
10.6%
42.2%
Growth Forecast (2024 – 2031)
| Year | Market Value (USD Bn) | Key Milestone |
|---|---|---|
| 2024 | 5.08 | Post-pandemic expansion phase |
| 2026 (Now) | 7.51 | Integration of Blockchain/IoT |
| 2031 | 11.68 | Full automation in Tier-1 cities |
Market Share by Application