
When conducting any form of quantitative research—whether it’s a nationwide political poll, a customer satisfaction survey for a local cafe, or a complex market entry study in Indonesia—the first question every researcher must answer is: “How many people do I need to talk to?”
Sample size is the heartbeat of data integrity. Choose too few people, and your results are little more than guesswork. Choose too many, and you waste precious time and resources. This guide provides a comprehensive breakdown of sample size theory, practical applications, and a step-by-step tutorial on how to use the Sample Size Calculator by RisetLokal.com to get pinpoint accuracy every time.
1. Introduction: The Theory of Sampling
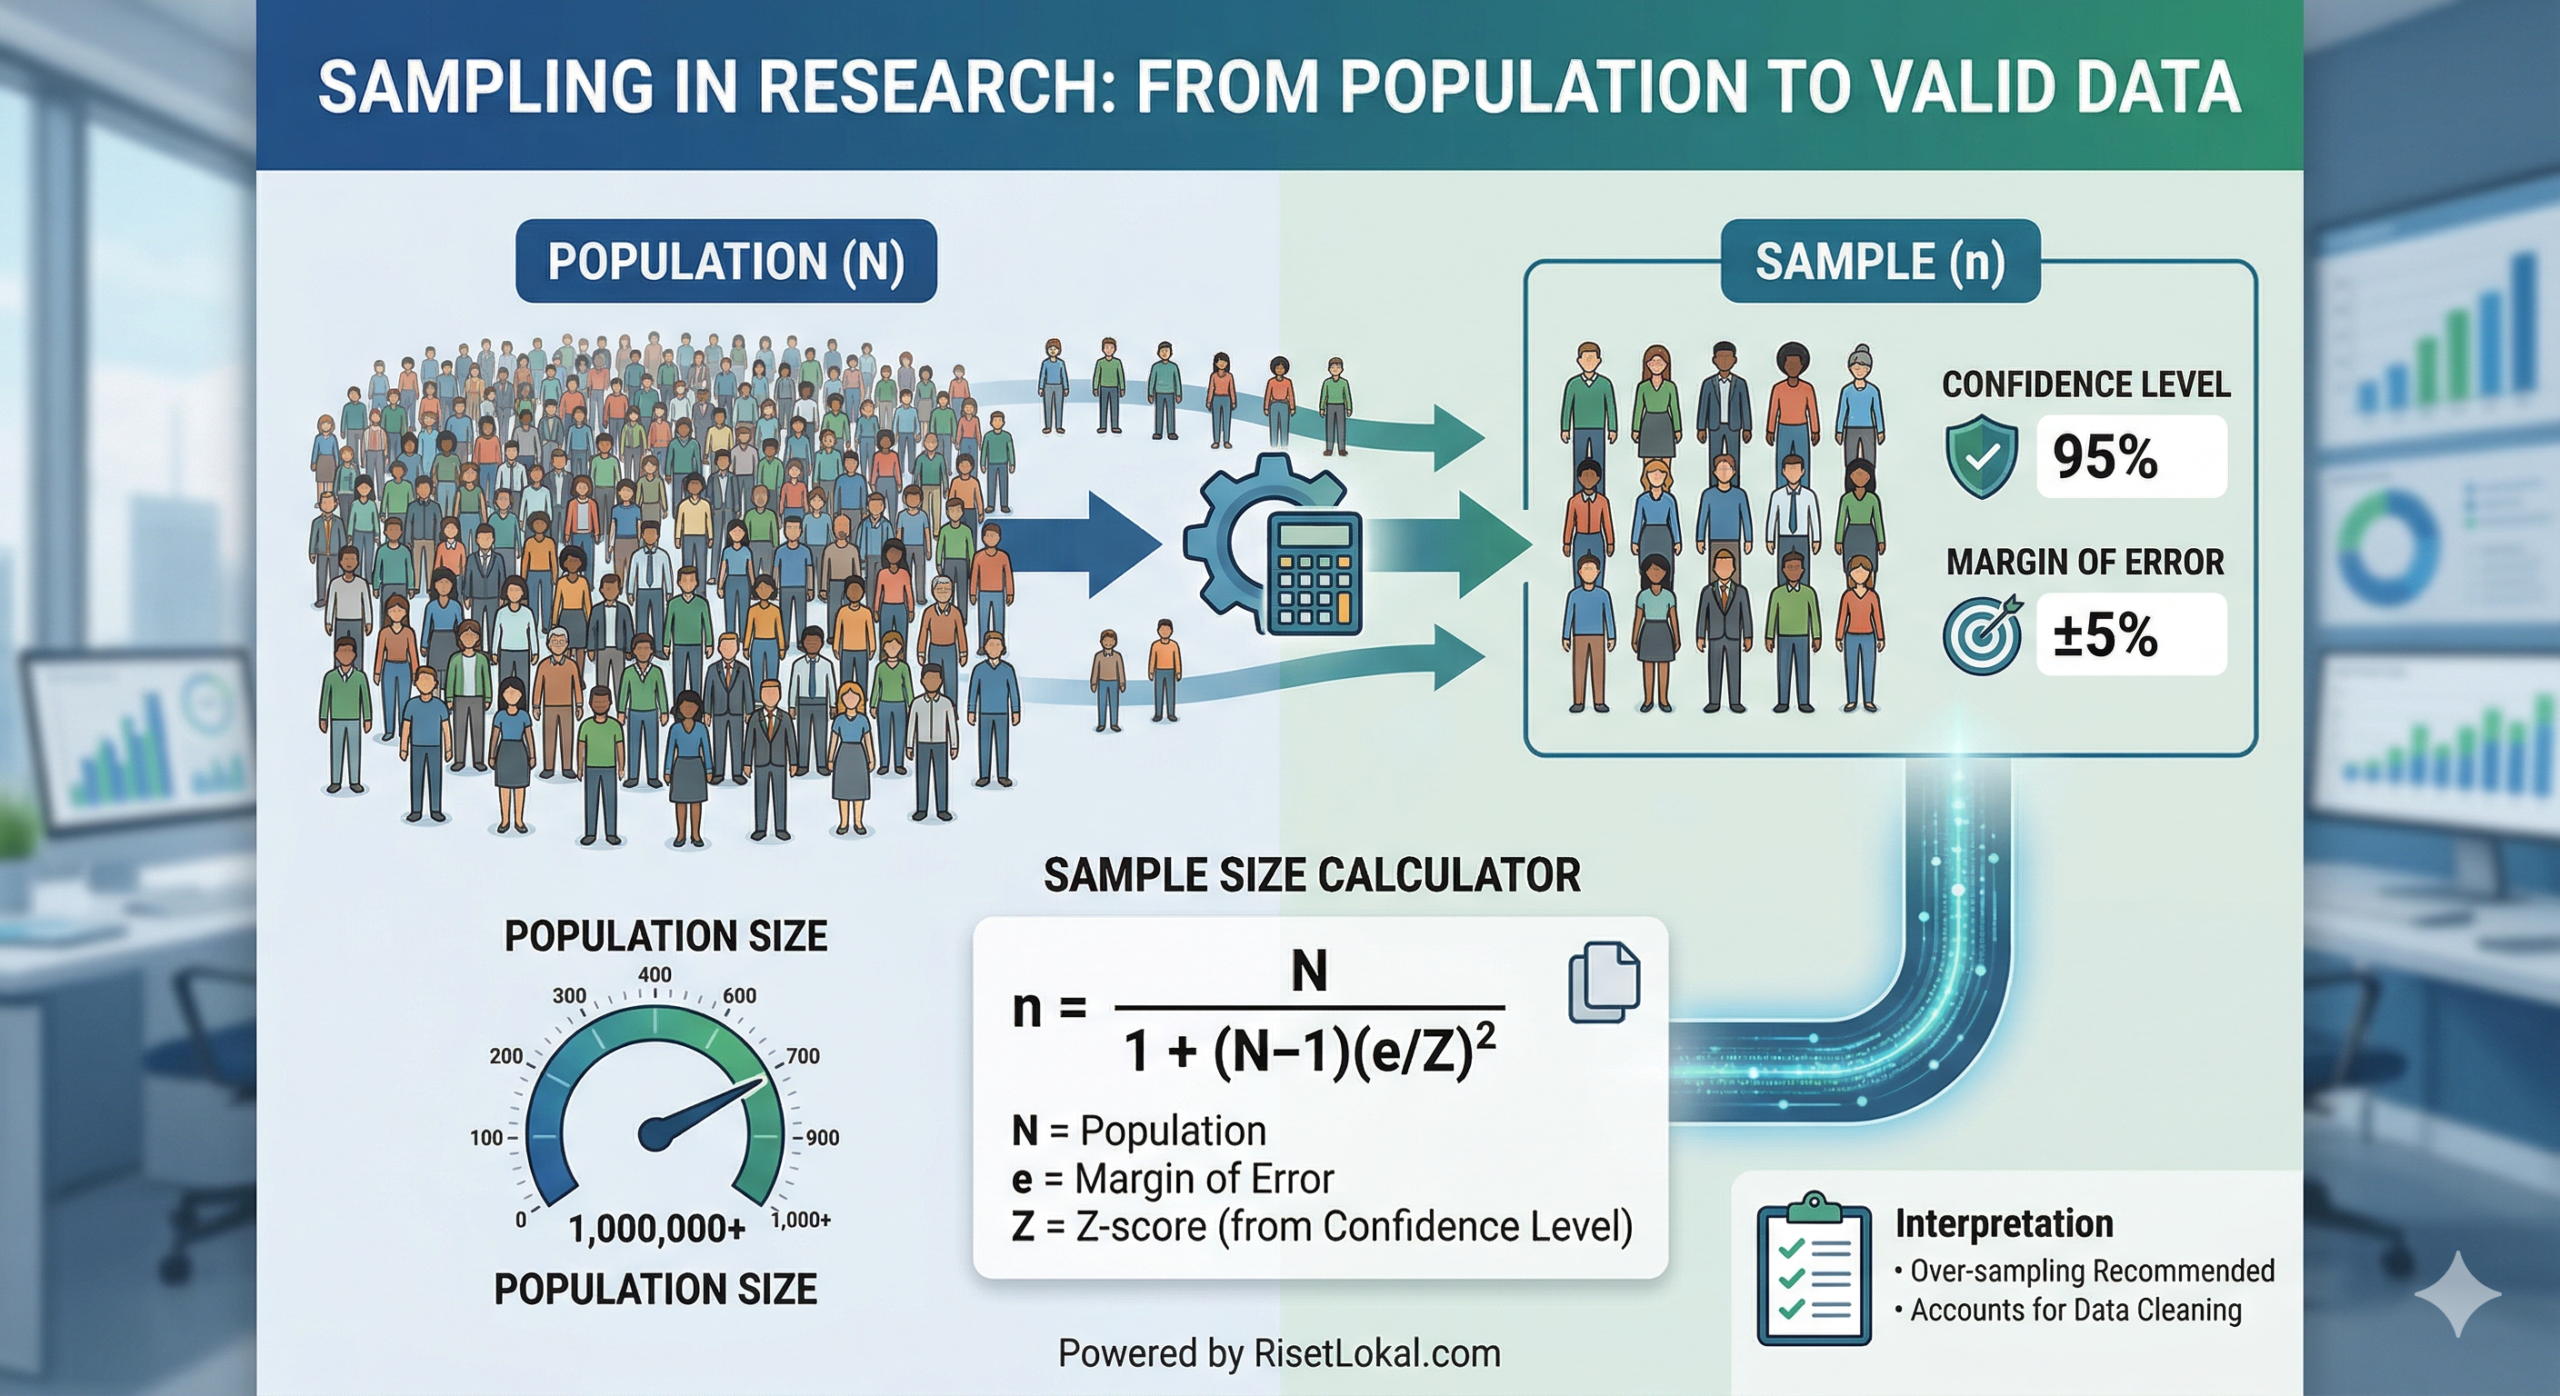
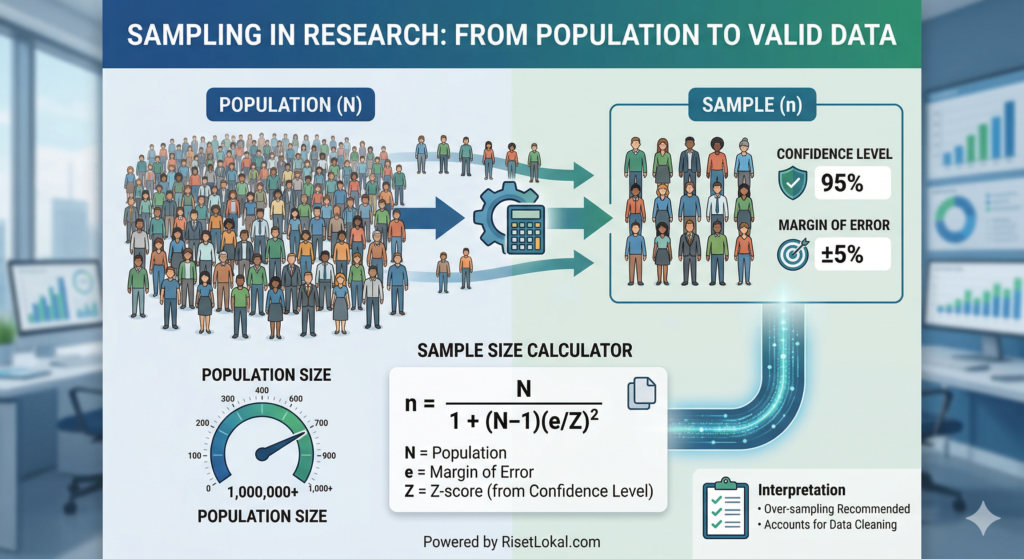
In statistics, we rarely have the luxury of surveying an entire “Population” (the total group of individuals we want to study). Instead, we take a “Sample”—a smaller subset that represents the whole.
Shutterstock
Explore
To make sure this small group accurately reflects the large group, we rely on three core pillars of statistical theory:
A. Confidence Level
This represents how sure you can be that the results from your sample reflect the true population. The industry standard is 95%. This means if you conducted the same survey 100 times, the results would match the population’s true feelings 95 times out of 100.
B. Margin of Error (Confidence Interval)
No sample is perfect. The margin of error is the “plus-or-minus” range around your result. For example, if 60% of your sample likes your product with a 5% margin of error, the true population percentage likely falls between 55% and 65%.
C. The Finite Population Correction (FPC)
If your population is relatively small (e.g., only 500 employees in a company), you need fewer people proportionately than if you were surveying the entire population of Jakarta. The formula adjusts the sample size downward when the sample represents a large chunk of the total population.
The Mathematics Behind the Magic
The calculator uses the Cochran Formula for large populations, adjusted for finite populations where applicable:
Where:
- n = Sample size
- Z = Z-score (determined by confidence level)
- p = Expected proportion (0.5 is used as it provides the most conservative/safest sample size)
- e = Margin of error (expressed as a decimal)
- N = Population size
2. Real-Life Use Case: Launching a New Coffee Brand in Bandung
Let’s look at a practical scenario. Suppose you want to launch a “Premium Gula Aren Latte” specifically targeting residents of Bandung, Indonesia.
- The Population (N): Bandung has roughly 2.5 million residents. Since this is a large number, we call it a “Large Population.”
- The Goal: You want to know if they would pay IDR 35,000 for your coffee.
- The Risk: If you survey only 50 people, and 40 say “Yes,” you might invest billions only to find out those 50 people weren’t representative.
Using a 95% Confidence Level and a 5% Margin of Error, our calculator would tell you that you need 385 responses. If you reach this number, you can confidently tell investors that your data is statistically significant for the entire city.
3. How to Use the RisetLokal.com Sample Size Calculator
📊 Sample Size Calculator
✅ Required Sample Size:
Where Z = Z-score, p=0.5 (conservative), e=margin/100
How to read: This is the minimum number of valid responses needed for reliable results at your settings. Always round up if fractional. For infinite/large populations, no correction is applied. Increase sample for subgroups or lower response rates.
Need Indonesia market research reports? Visit risetlokal.com
For professional market research services in Indonesia, contact risetlokal.com
Using our embedded tool is straightforward. Follow these steps to get your numbers:
- Identify Population Size (N): Enter the total number of people in the group you are studying. If you are surveying “All smartphone users in Indonesia,” you can leave this blank or enter a very high number (the calculator treats empty fields as an “Infinite” population).
- Select Confidence Level: * 90%: Good for quick, low-stakes pilot tests.
- 95%: The gold standard for most business and social research.
- 99%: Reserved for medical trials or high-risk financial decisions.
- Enter Margin of Error: Most researchers aim for 5%. If you need higher precision (like for government policy), you might go down to 2% or 3%. Note that lowering the margin of error significantly increases the required sample size.
- Click “Calculate”: The tool will instantly generate the minimum number of valid responses you need.
4. Interpretation: How to Read and Apply Your Results
Once the calculator gives you a number (e.g., “385”), what do you do next?
The “Clean Data” Buffer
The number provided by the calculator is the required number of valid, completed responses. In the real world, people skip questions or give “troll” answers. We recommend oversampling by 10-20%. If the calculator says 385, aim for 450 to account for data cleaning.
Diminishing Returns
You will notice that if you increase your population from 1 million to 10 million, the sample size barely changes. This is a common misconception! Once a population reaches a certain size, the sample size required for a specific margin of error stays almost constant.
Implementation in Indonesia
Conducting research in Indonesia presents unique geographical challenges. Whether you are doing face-to-face interviews in Medan or digital surveys in Surabaya, reaching your calculated sample size requires local expertise.
Expert Note: If you find the required sample size is too high for your budget, you have two choices: increase your margin of error (e.g., from 5% to 7%) or lower your confidence level.
Strategic Market Research with RisetLokal
Calculating the sample size is only the first step. The real challenge is finding those people and ensuring they answer honestly.
RISETLOKAL.COM is Indonesia’s native partner for localized market research. We specialize in reaching diverse demographics across the archipelago—from the bustling streets of Jakarta to the remote areas of Papua. Whether you need a simple sample size consultation or a full-scale consumer behavior report, RisetLokal.com provides the boots-on-the-ground data you need to win in the Indonesian market.
For professional market research services that go beyond just numbers, visit RisetLokal.com or contact our team for a custom quote on your next project.
Frequently Asked Questions
Q: Can I use a sample size of 30?
A: In very small, controlled experiments, 30 is often cited as a minimum for the “Central Limit Theorem” to kick in. However, for market research, 30 usually results in a massive margin of error (around 18%), which is too risky for business decisions.
Q: Why does 95% confidence require more people than 90%?
A: To be more certain that your results aren’t due to random chance, you need a larger “net” (more people) to catch the true population mean.